We’d all be pulling our hair out if we looked at the status of our investment every day. One day we are up; the next we are down. As employers, you should steer clear of offering investment advice to your employees, but you can steer them toward helpful guidance from authoritative sources. One of the best ways to do this is to help them find resources that will put the current nerve-wracking events in an historical context.
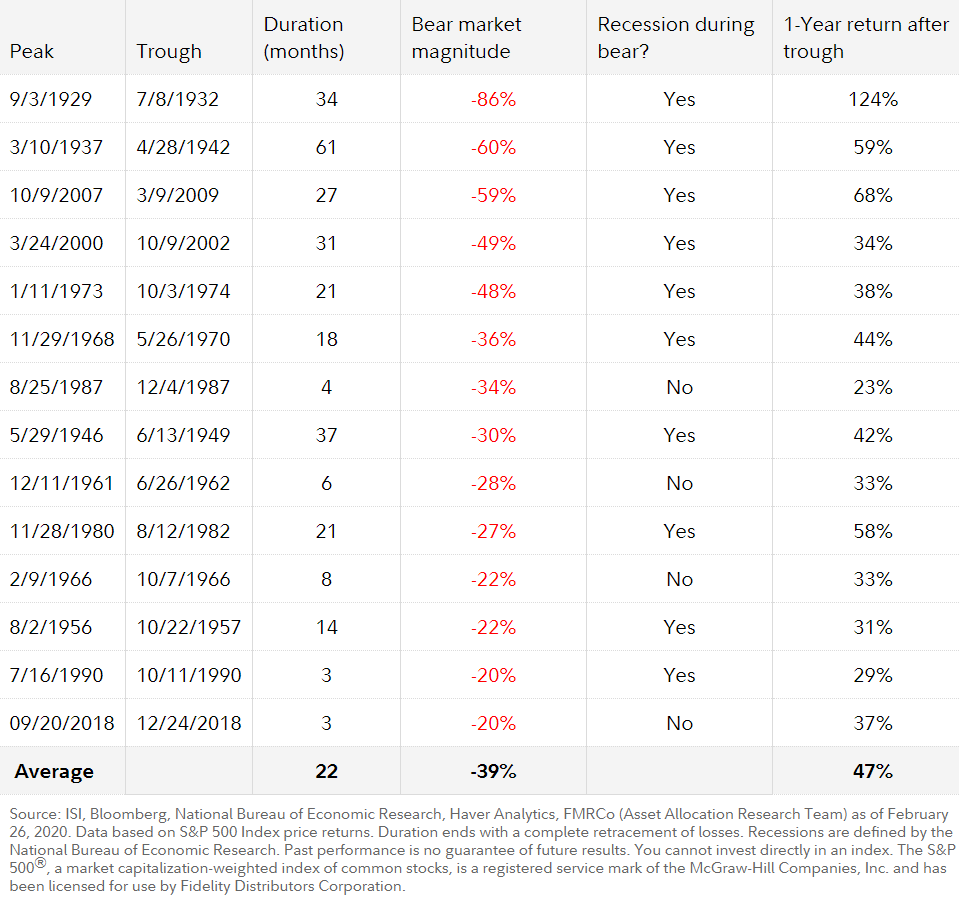 For example, this chart from Fidelity Investments lists vital statistics for every stock market peak-to-trough decline of at least 20% since 1929. A 20% drop is the common definition of a bear market.
Using the Standard & Poor (S&P) 500 as a proxy for the stock market, 16 bear markets have occurred since 1926, and on average it takes 22 months for markets to return to the prior peak. The longest was 37 months from 1946 to 1949. The two shortest drops lasted only three months in 1990 and 2018.
In addition, the magnitude of bear market declines has varied from 86% in 1929 to 20% during the mini-crashes in 1990 and 2018. The average bear market decline has been 39%.
Where the stock market is headed from here is unpredictable. But another set of statistics in the “bear market basics” report is noteworthy. It shows that the stock market usually has risen at a fast pace (averaging 47% in the first 12 month of the periods measured) after it hits bottom.
The lesson? Investors who bail out of bear markets on the way down need to be very good at predicting when precisely things will turn around. Otherwise, it may take them a lot longer to reverse some of their bear market losses, than if they had simply stayed put.
Pingback: Keep Calm but Know the Options About 401(k) Contributions - Bailey Scarano